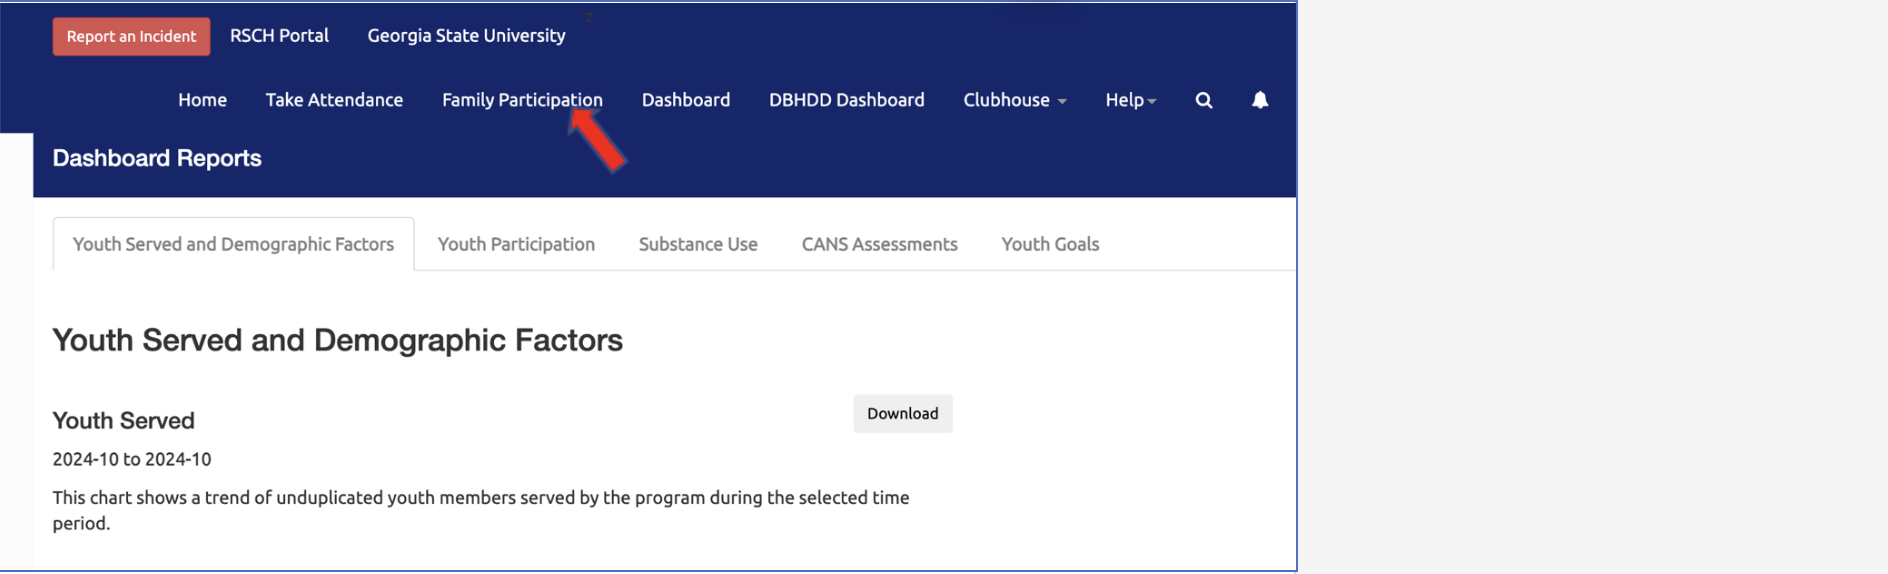
Select the Dashboard link from the top right menu:
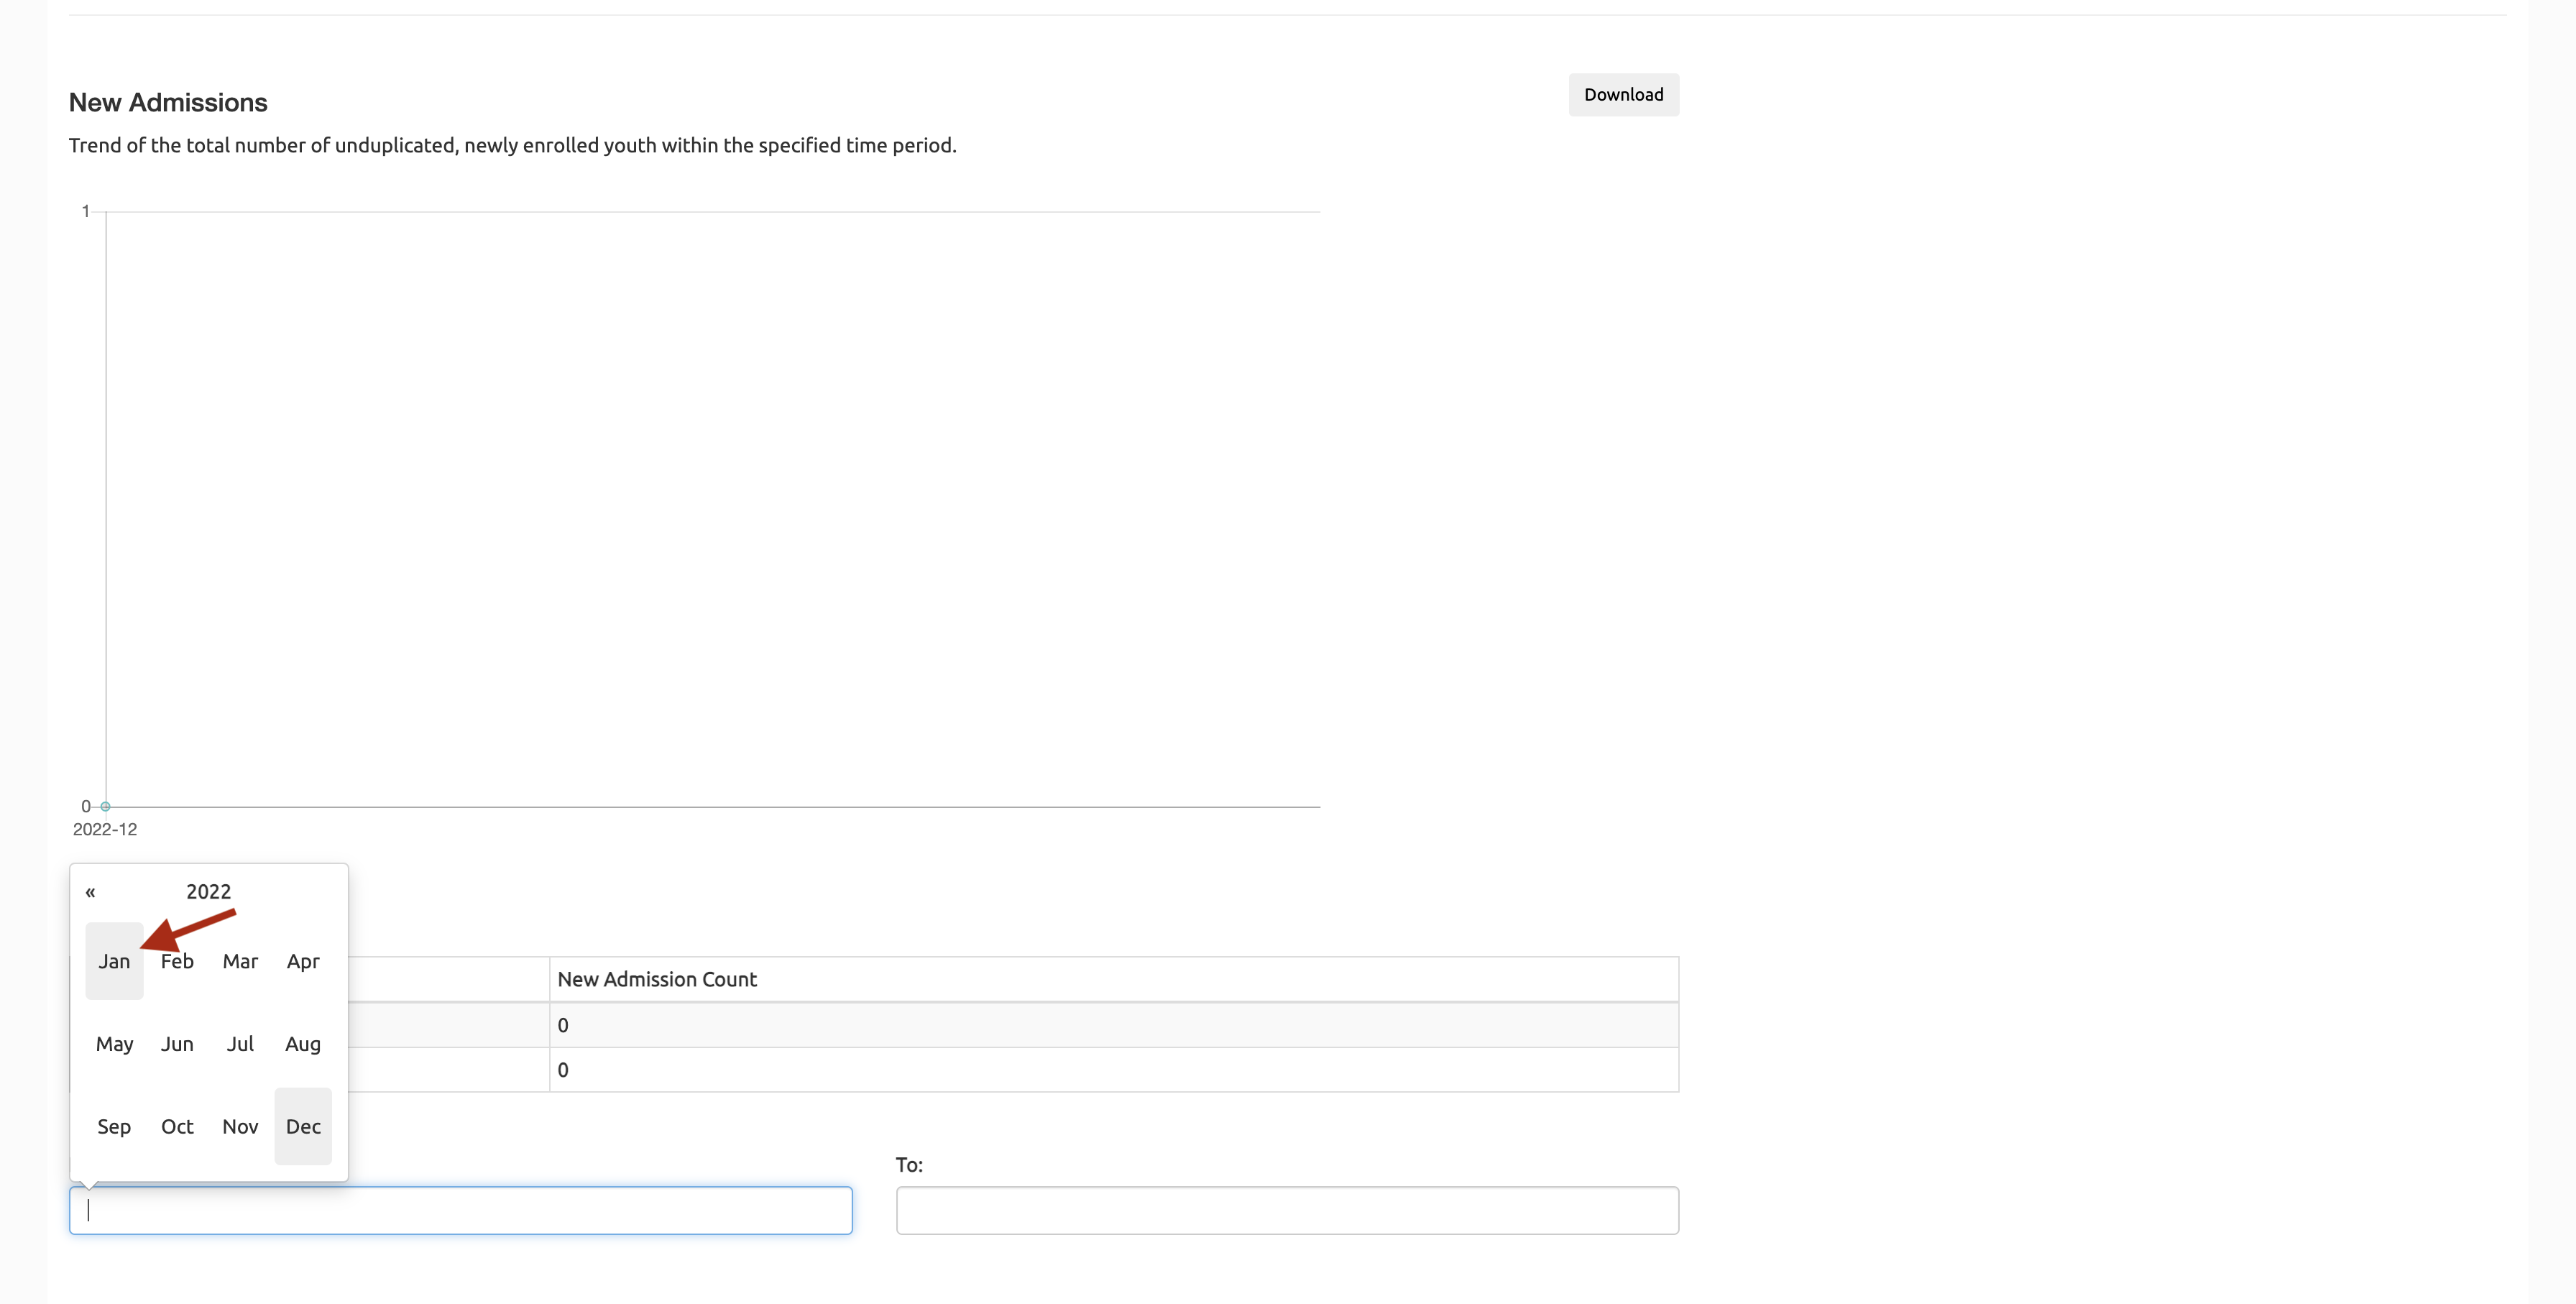
In the Dashboard view, for each graph, select months from the "From" and "To" date fields to display the counts for a specific time range:
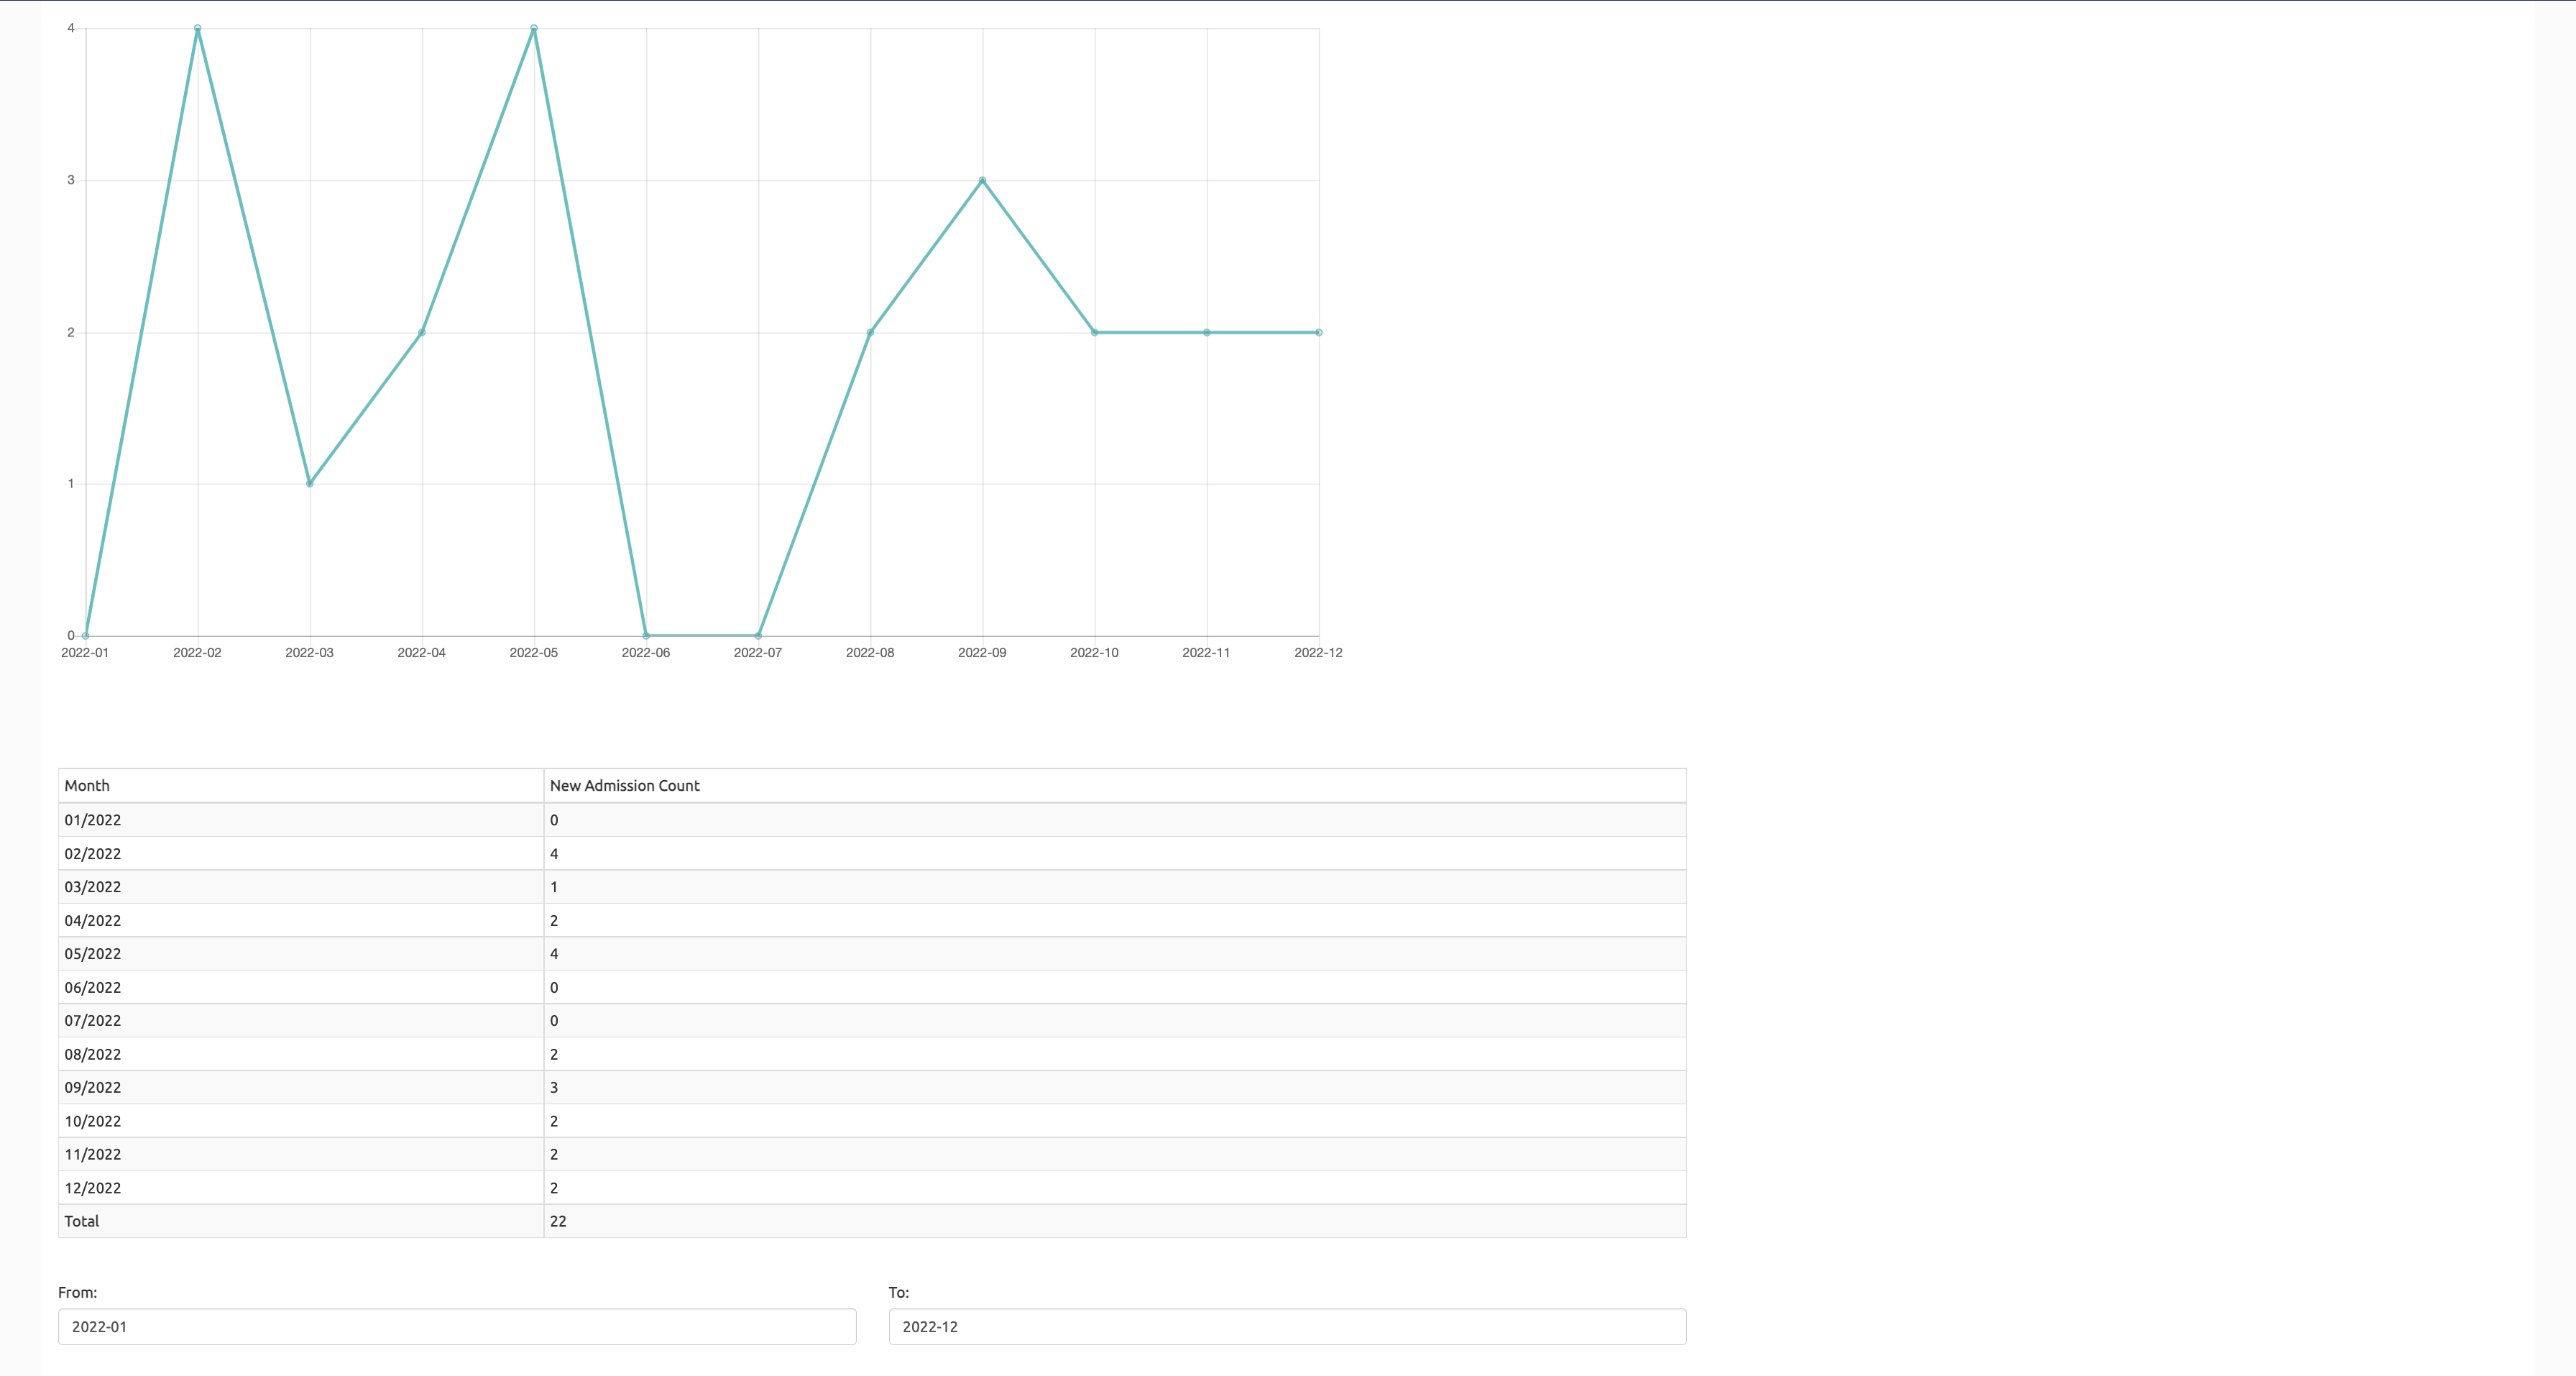
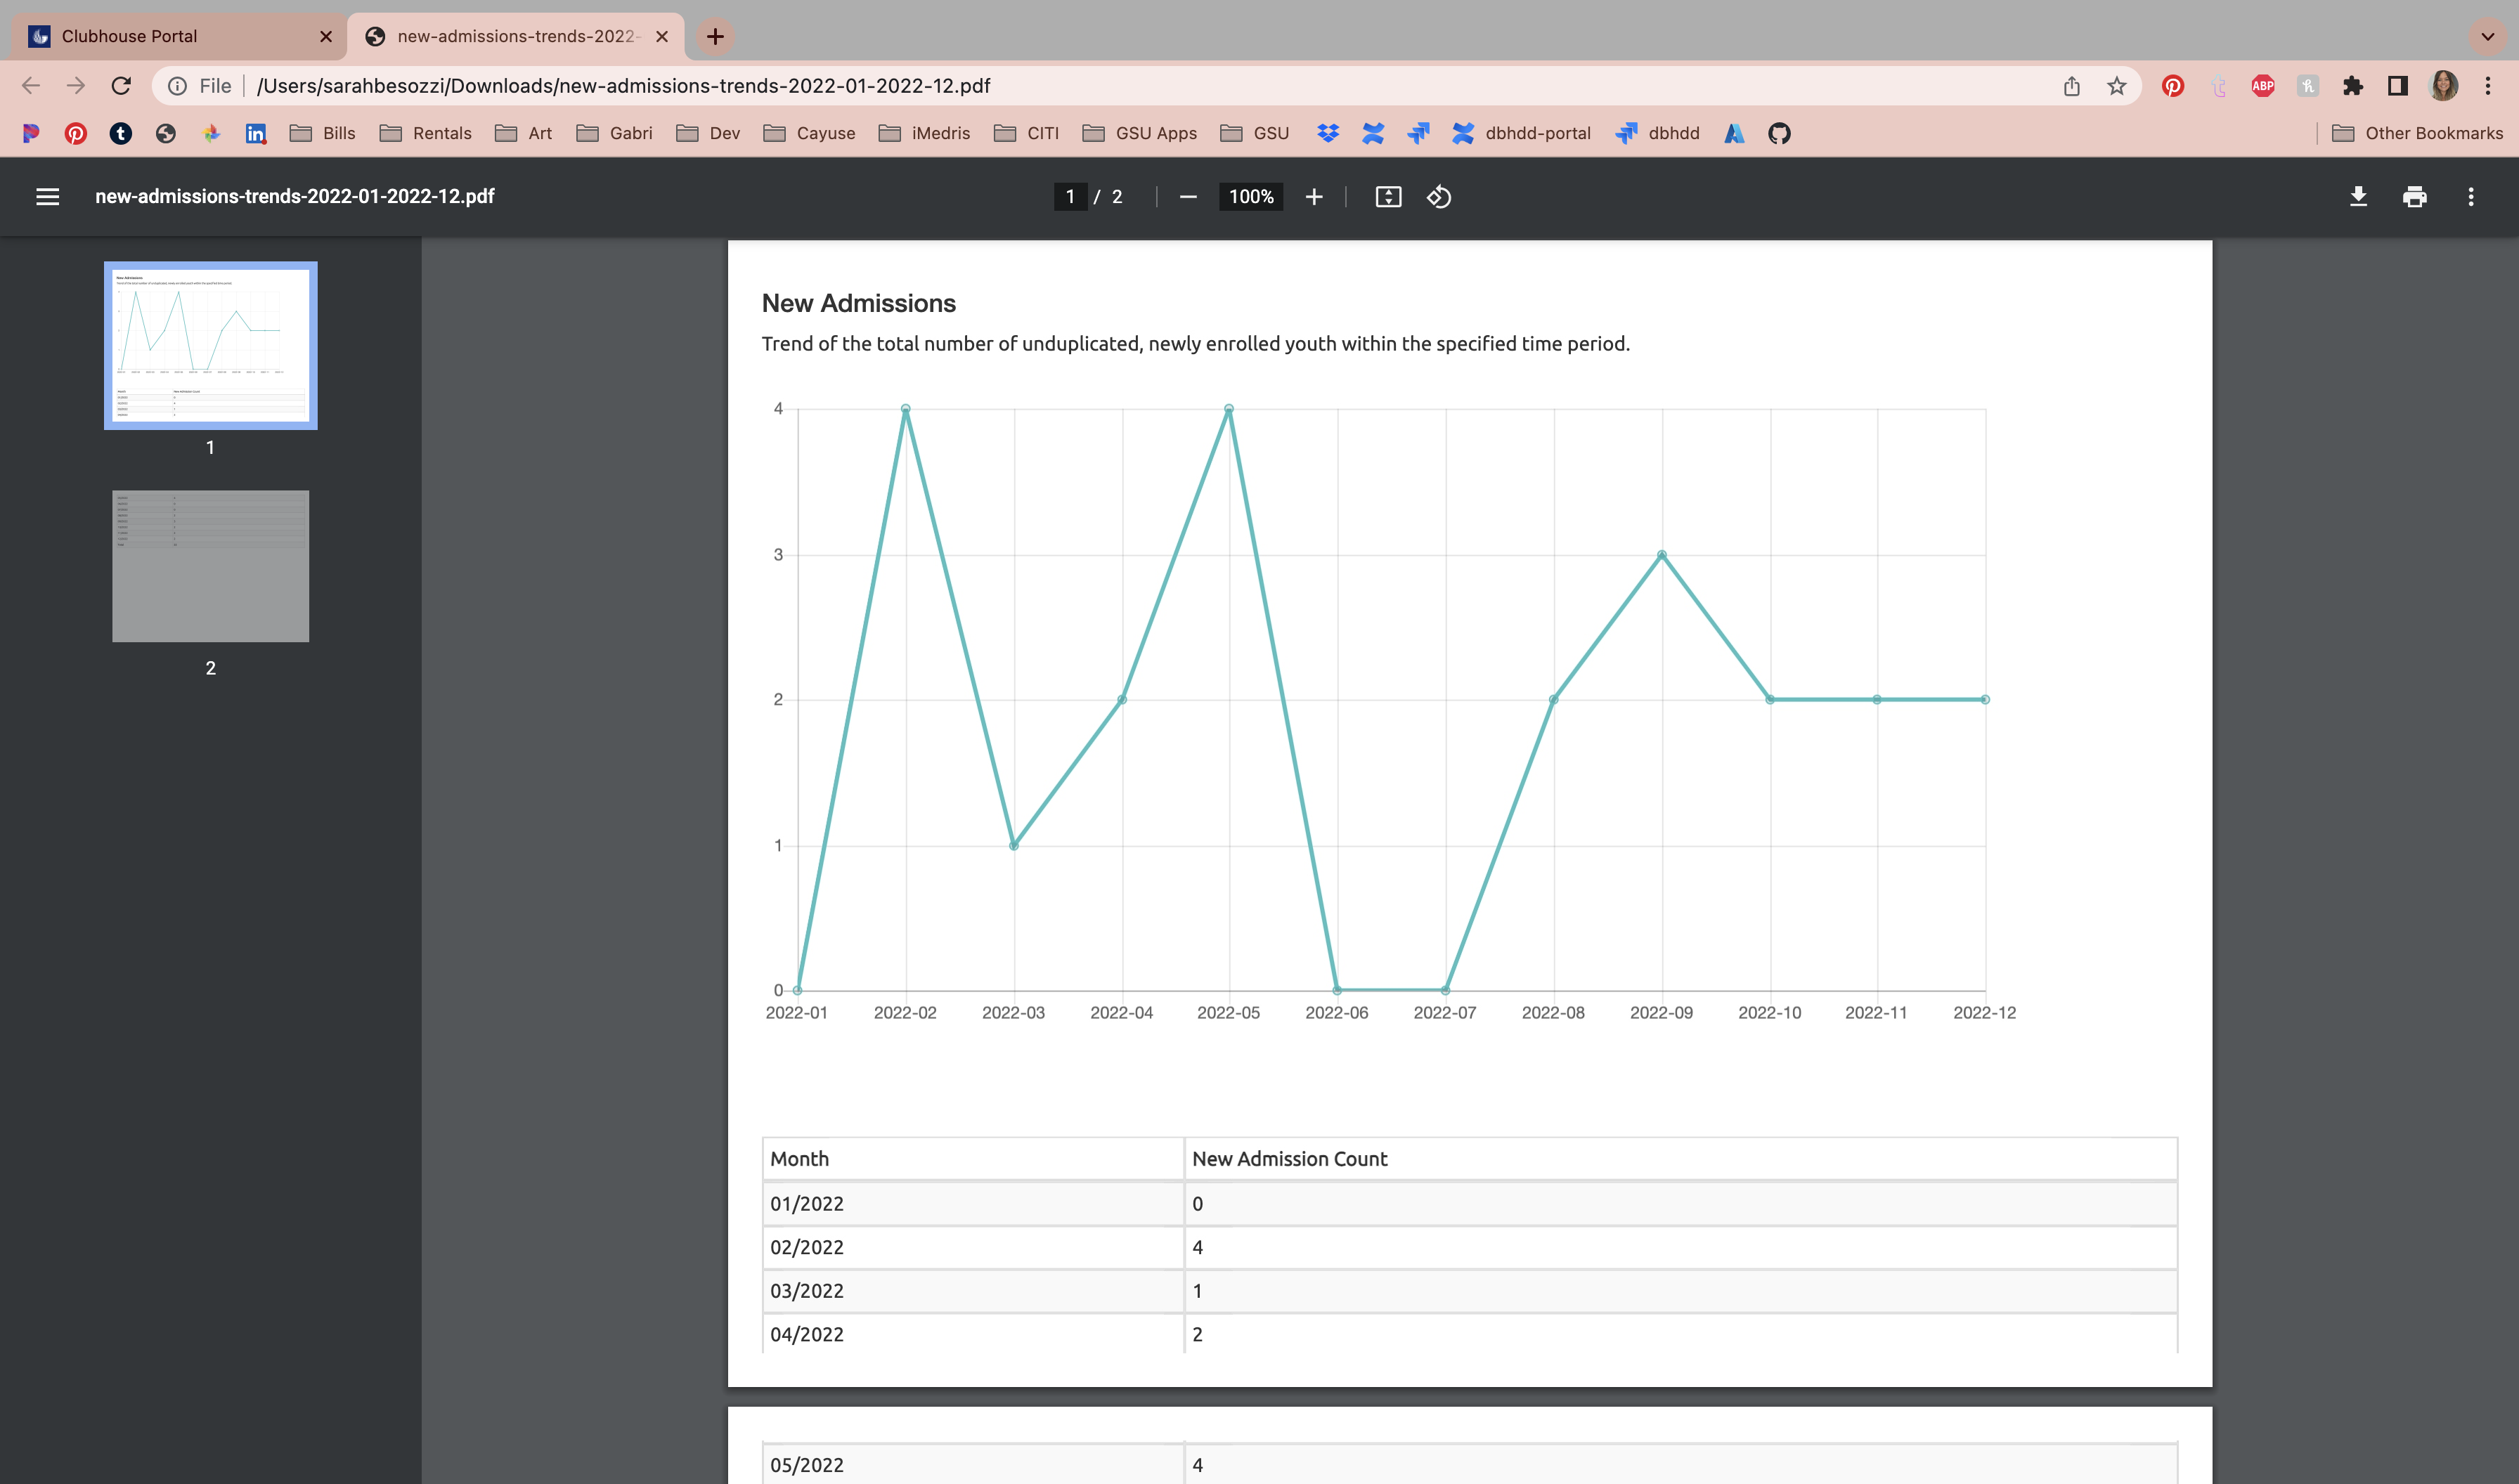
This will display the counts in the graph and in the table below:
To download the report, select the "Download" button to the top right of the char
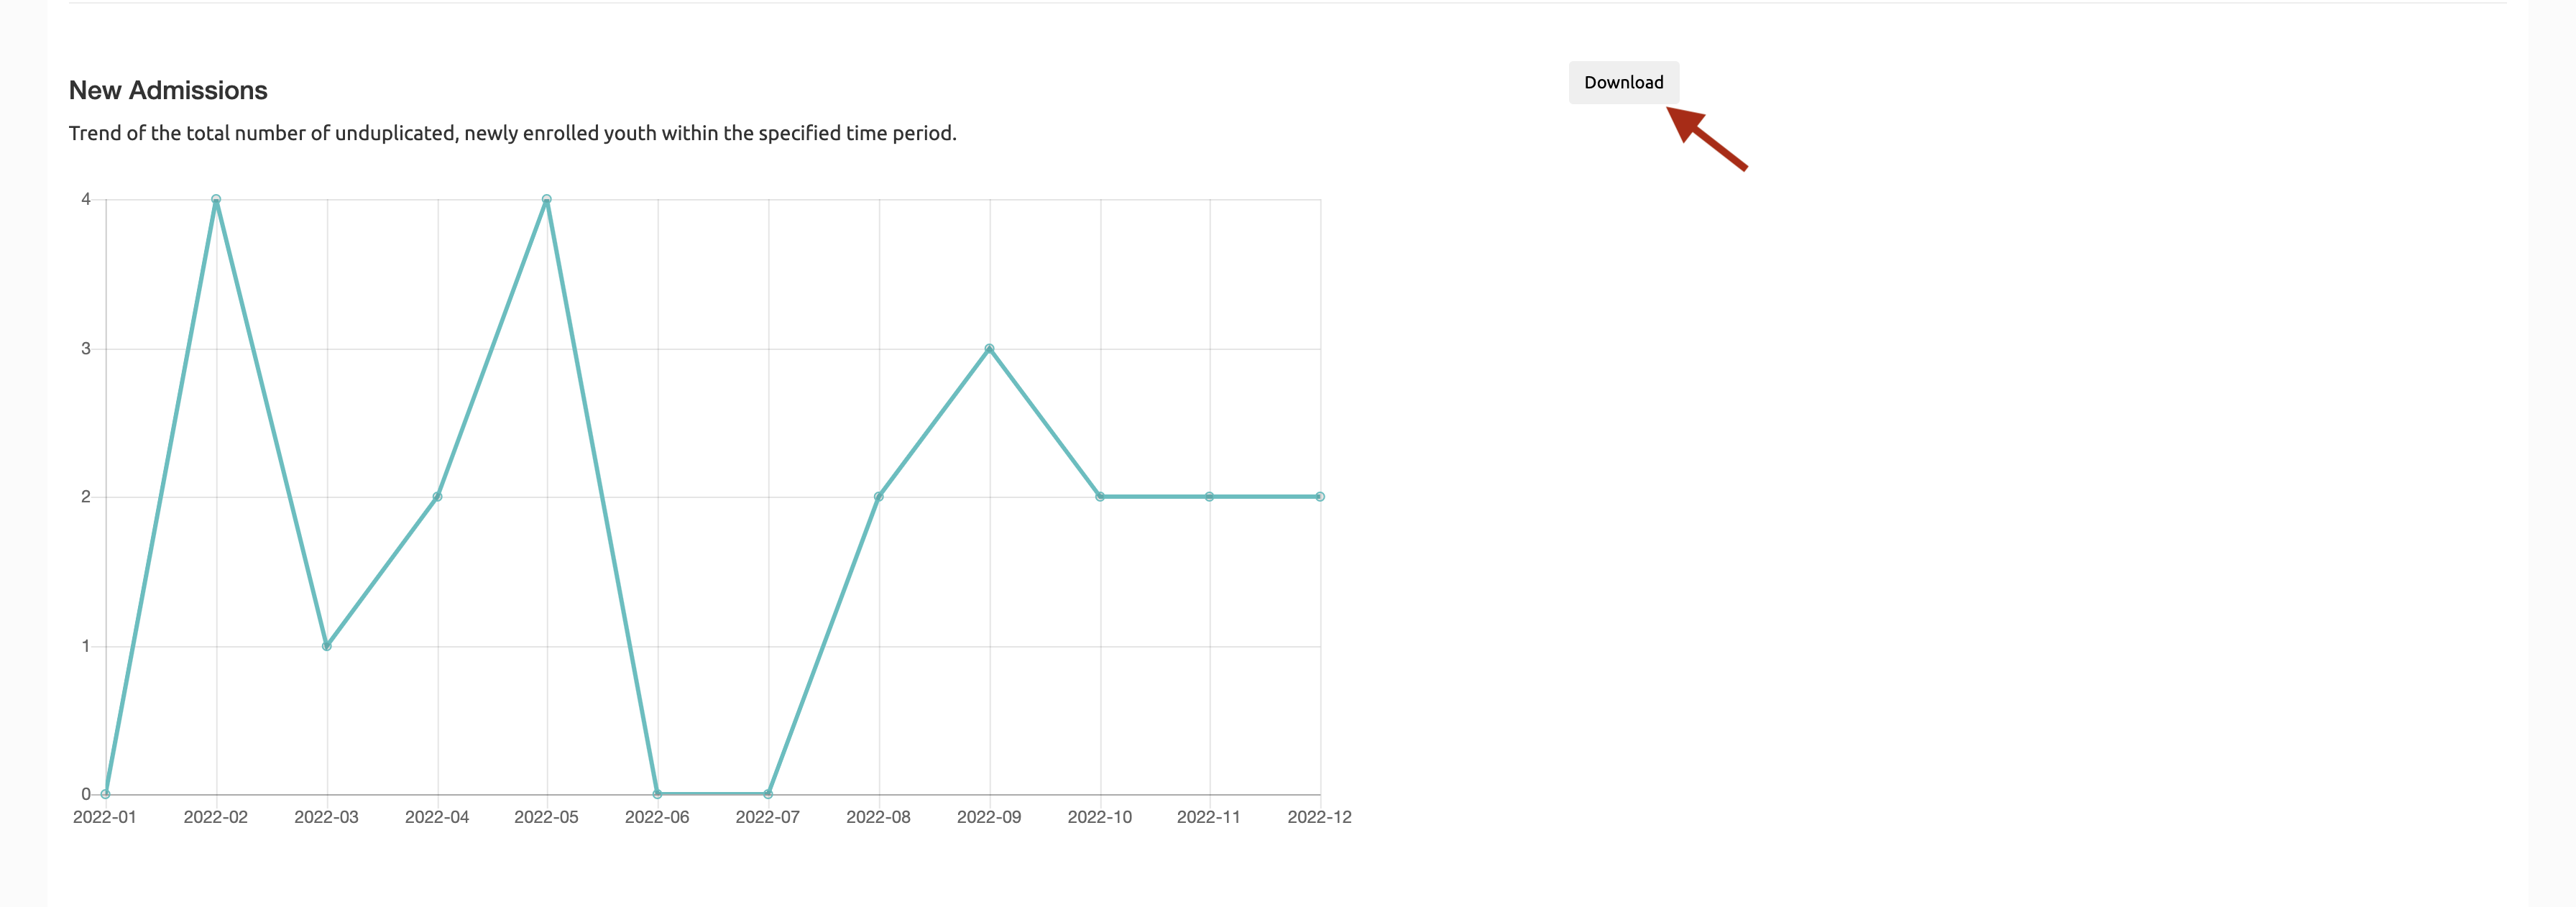
The report will open the document in a new browser tab or save to your Downloads folder, depending on your operating system. Save the document.
Still need help? Reach out to the Research Solutions Team at researchsolutions@gsu.edu.